For Busy Readers
This is not an argument that the US equity market is finished. The United States still has the deepest capital market in the world, the broadest liquidity pool, and many of the strongest companies ever built. The harder question is different: can the investment regime that worked so well over the last decade keep working in the same way?
The 2010s were generous to US equity investors. Low rates, abundant liquidity, a strong dollar, globalization, mega-cap technology earnings, and steady passive inflows all pushed in the same direction. When the market corrected, the central bank often softened the landing. When the dust settled, the largest growth companies usually pulled the index higher again.
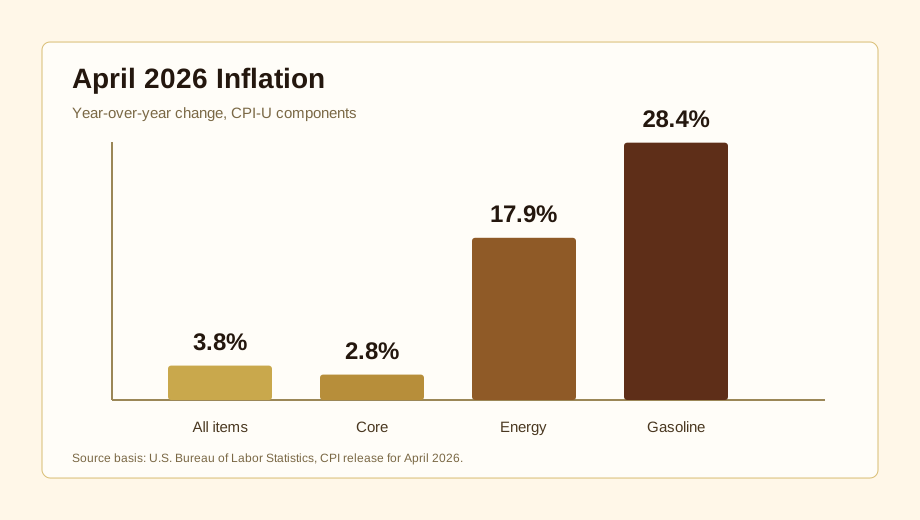
May 2026 looks less forgiving. The April 2026 CPI report showed US headline inflation running at 3.8% year over year, while energy prices were up 17.9%. Leadership changes at the Fed have put central-bank independence back on the market’s agenda. At the same time, broad US equity exposure is becoming less broad than it appears: the index is leaning more heavily on AI, semiconductors, and mega-cap technology.
The conclusion is simple.
The US equity market is not over. The easy market may be.
Over the next decade, “what should I own?” may matter less than what price am I paying, how concentrated is the exposure, and how well does the portfolio handle inflation and a changing dollar system. That is why 2026 echoes 1973. History does not repeat cleanly. It does, however, sometimes rhyme in ways investors would rather ignore.


1973 Was Not Just a Bad Year. It Was a Break in the System
The story starts before 1973. On August 15, 1971, President Richard Nixon suspended the dollar’s convertibility into gold, announced wage and price controls, and introduced an import surcharge. The US Office of the Historian describes the decision as the practical end of the Bretton Woods fixed-exchange-rate system.
That was more than a currency adjustment. Before the break, the dollar was anchored to gold and other major currencies were linked to the dollar. After the break, the dollar rested more clearly on the United States’ institutional credibility, Treasury market depth, military power, and financial network.
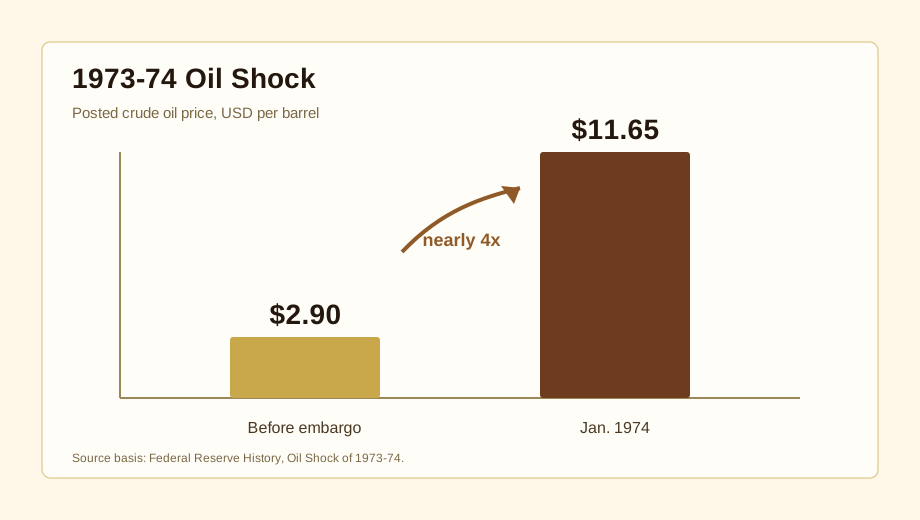
Then came oil. According to Federal Reserve History, crude prices moved from $2.90 per barrel before the embargo to $11.65 by January 1974. A fourfold move in energy was not just a commodity story. It touched transportation, manufacturing, heating, food, wage bargaining, and profit margins.
It is worth being precise about the trigger. The oil shock was not directly caused by the Six-Day War of June 1967, often counted as the third Arab-Israeli war. The immediate catalyst was the Yom Kippur War, which began on October 6, 1973 and is often counted as the fourth Arab-Israeli war. The 1967 war mattered because it left territorial and security disputes unresolved. The 1973 war turned that background tension into an energy-market shock.

Inflation did not look terrifying from the first day. Many policymakers initially treated the pressure as a temporary cost shock. The mistake was that cost shocks can become wage demands, pricing behavior, and inflation expectations. Once that happens, monetary policy has to do more than absorb pain. It has to rebuild trust.
This is why 1973 matters for investors. When the inflation regime changes, even good businesses are repriced. Higher rates change the value of future earnings. Higher input costs squeeze margins. Higher required returns make long-duration growth stories less forgiving.
2026 Is Not 1973. But the Rhyme Is Uncomfortable
The United States of 2026 is not the United States of 1973. The economy is less energy-intensive, services and software matter more, and the Fed has a far better toolkit. Still, a few similarities are hard to dismiss.
First, politics is moving back into the center of economic policy. Nixon touched the dollar, tariffs, wages, and prices in one package. Today, tariffs, the dollar, the Fed, energy, and industrial policy are again being treated as connected political instruments. This is not only a left-right question. It is a question of how directly political power rewrites market rules.
The Nixon-Trump parallel is not simply that both men liked tariffs. It is that both treated the international economic order as something to be rewritten under domestic political pressure. Nixon closed the gold window, imposed wage-price controls, and added an import surcharge in one move. Abroad, that looked like American unilateralism. The Trump administration has similarly connected tariffs, pressure on the Fed, the dollar, and the trade order into one political language. The difference matters too: Nixon was trying to manage a dollar system that had lost its gold anchor; Trump is trying to renegotiate trade, rates, and supply chains inside an already fiat-dollar system.
Second, central-bank independence is a live market variable again. The Fed said on May 15, 2026 that Jerome Powell would serve as chair pro tempore while Kevin Warsh’s appointment process was pending. Investors now have to consider not only the policy rate, but also how much credibility the central bank can retain under political pressure.
Arthur Burns and Kevin Warsh should not be treated as the same kind of policymaker. Their similarity is not temperament; it is the position they occupy. Burns led the Fed when politics and inflation were pressing on the institution at the same time. Warsh arrives when politics and markets are again demanding different things from the central bank. The difference is more important. Burns is remembered for being late against inflation. Warsh, by contrast, has been read by Reuters as a figure more likely to push for a smaller Fed balance sheet and a tighter communications regime. That may not mean an easier Fed. It may mean a Fed that is less willing to soothe markets while fighting inflation.
Third, inflation is not disappearing quietly. The April 2026 CPI report showed headline inflation at 3.8%, core inflation at 2.8%, energy up 17.9%, and gasoline up 28.4%. The point is not that the 1970s are back. The point is that sticky inflation makes the old “the Fed will always rescue duration” reflex harder to trust.
Nifty Fifty, Magnificent Seven, and the Price of Certainty
The lesson of the Nifty Fifty is not that growth stocks are bad. Many of those companies were excellent businesses. Coca-Cola, McDonald’s, Johnson & Johnson, and others created enormous long-term value. The lesson is sharper:
A great company is not automatically a great stock.
A great company can have a strong brand, high returns on capital, pricing power, and a durable moat. A great stock needs one more thing: a price that leaves room for reality to disappoint.
The failure of the Nifty Fifty was not a failure of the companies. It was a failure of price.

The Magnificent Seven face the same test. AI may be a real platform shift. Data centers may become the next layer of productive infrastructure. Nvidia’s GPUs, Microsoft’s cloud, Alphabet’s AI stack, Amazon’s infrastructure, Meta’s advertising network, Apple’s ecosystem, and Tesla’s manufacturing story may all contain real economic substance.
But the investment question is different: how much of that future is already in the price?
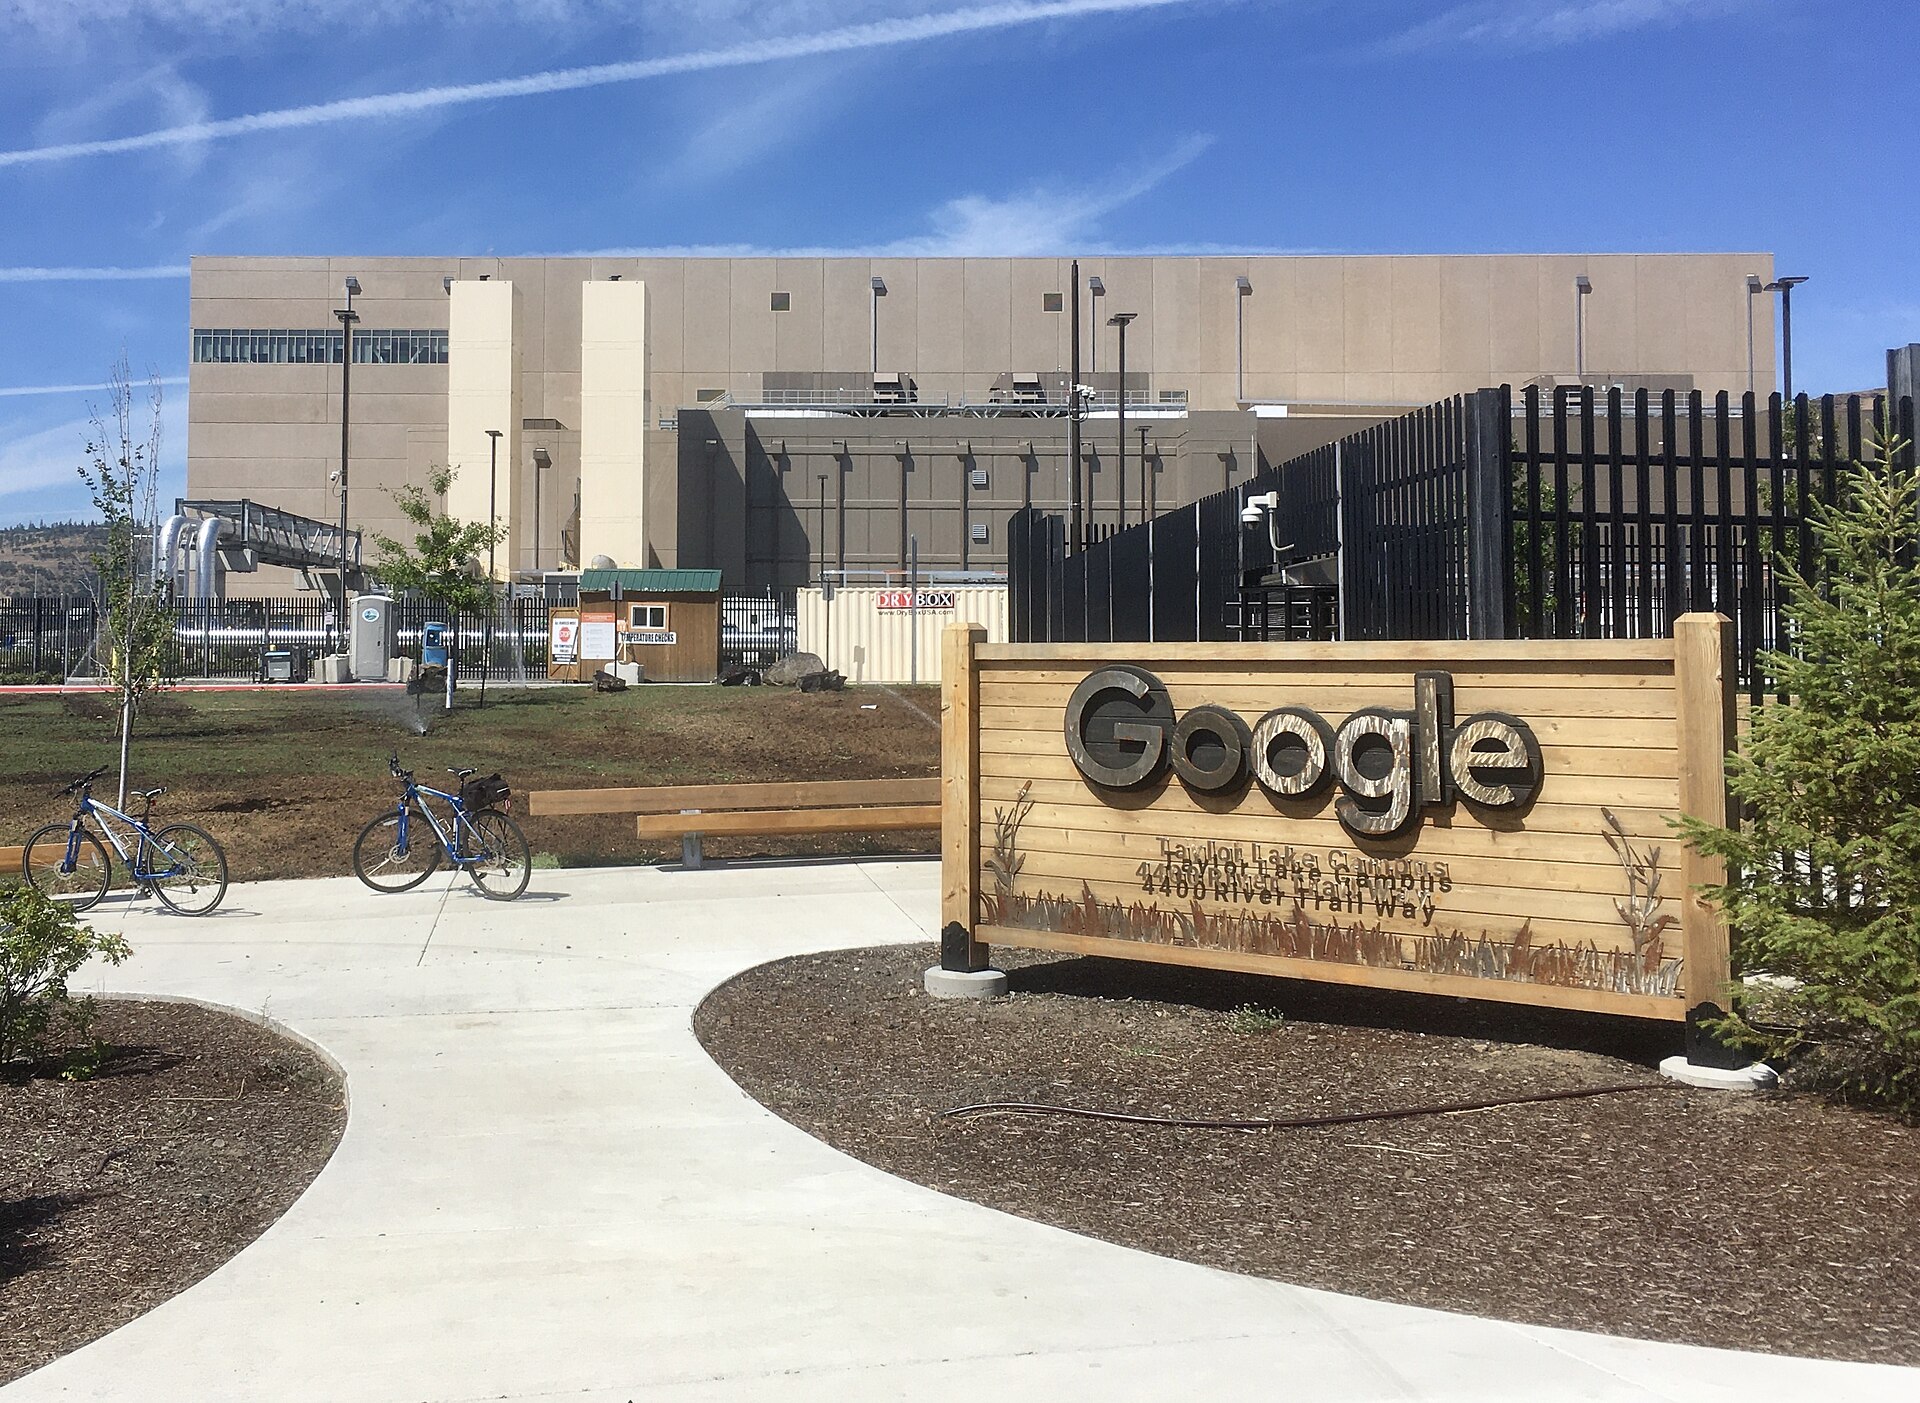
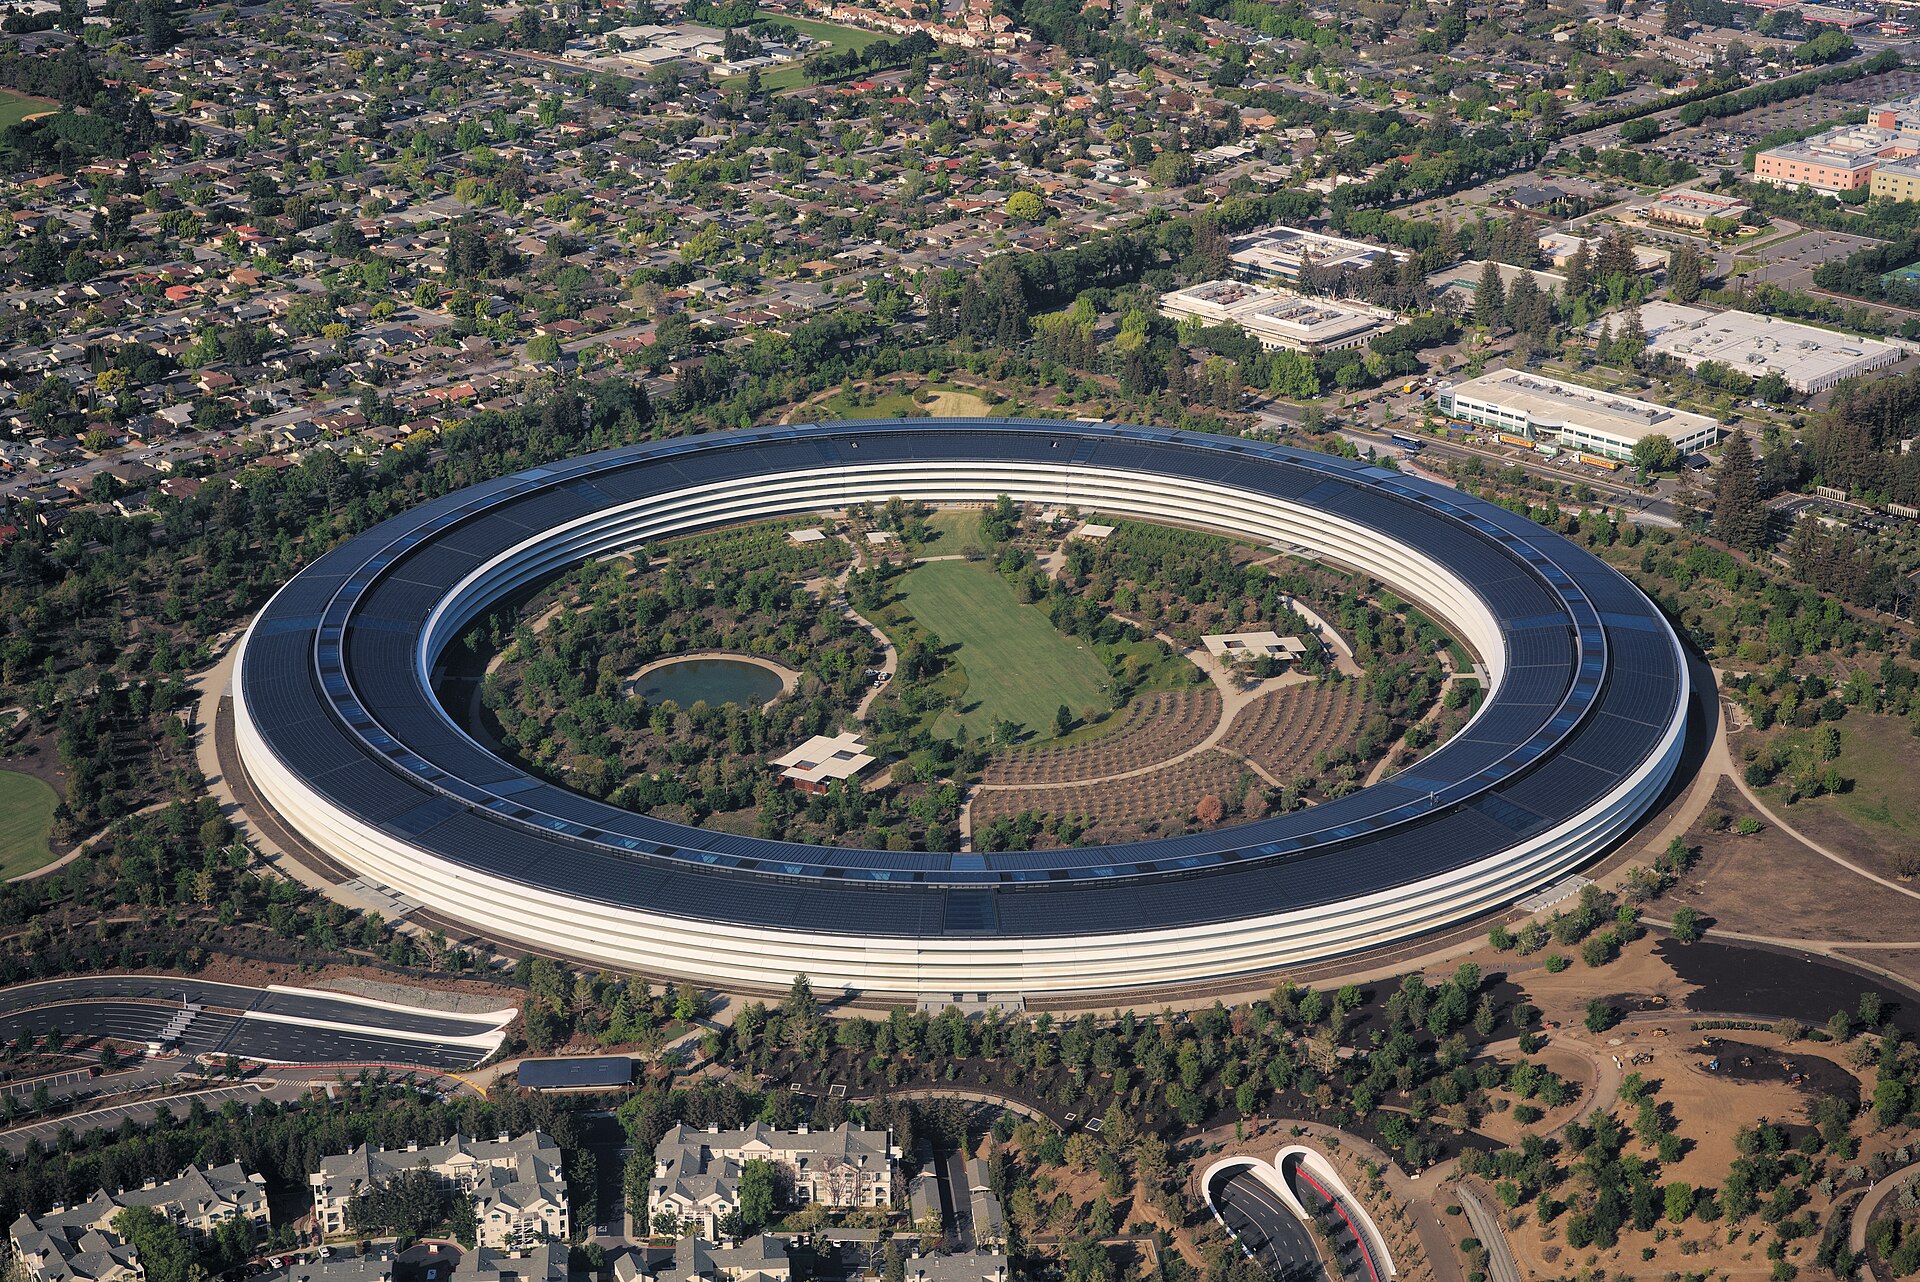
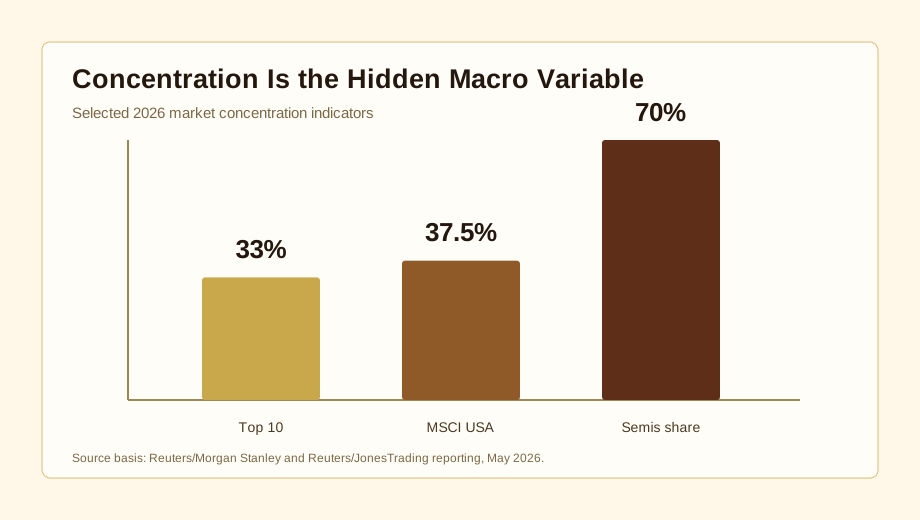
Reuters reported, citing Morgan Stanley analysis, that the top 10 US stocks accounted for 33% of total US market value and 37.5% of the MSCI USA Index in May 2026. Reuters also reported that semiconductor and memory names explained roughly 70% of the 2026 increase in S&P 500 market value through mid-May. That is not proof of a bubble. It is proof that the index is asking a small number of companies to carry a very large burden.
| Question | Early 1970s | 2026 | Investor issue |
|---|---|---|---|
| Market leaders | Nifty Fifty growth franchises | AI, semiconductors, mega-cap tech | Quality can be real while valuation is demanding. |
| Macro backdrop | Oil shock, inflation, weaker dollar anchor | Sticky inflation, energy pressure, dollar transition | The discount rate can move against long-duration equities. |
| Policy risk | Wage-price controls, political pressure on the Fed | Tariffs, Fed politics, fiscal strain | Policy becomes part of valuation, not background noise. |
| Portfolio habit | Own the obvious winners | Own the cap-weighted index | Concentration can hide inside familiar wrappers. |
Nominal Returns and Real Returns Can Tell Different Stories
The 1970s did not prove that equities are useless in inflationary periods. Corporate revenues can rise with nominal GDP. Some companies can pass costs through. Dividends can matter. But the decade did prove something uncomfortable: nominal gains can hide weak real outcomes.
When inflation is high, investors have to ask whether returns preserve purchasing power. A stock index can recover in dollar terms while still losing ground after inflation. Long bonds can look safe until rising yields reprice duration. Cash can stop being dead weight when short rates are high. Gold and commodities can function less as growth assets and more as insurance against monetary stress and supply shocks.
| Asset | Role in an inflationary regime | Key risk | What to watch |
|---|---|---|---|
| S&P 500 | Still core, but valuation and concentration matter more. | Multiple compression and narrow leadership | Equal-weight performance, earnings breadth |
| Short Treasuries | Can pay investors to wait when short rates are high. | Reinvestment risk when rates fall | Real short rates, Fed path |
| Long bonds | Useful recession hedge, weaker inflation hedge. | Term premium and fiscal pressure | 10Y/30Y yields, Treasury auctions |
| Gold | Insurance against monetary stress and dollar doubts. | No yield and crowded positioning | Real yields, dollar reserves, central-bank buying |
| Commodities / energy | Exposure to real-world bottlenecks and supply shocks. | Cycle risk and political intervention | Inventories, capex, geopolitical supply risk |
| Bitcoin | High-beta scarce asset with optionality. | Liquidity sensitivity and regulatory risk | Real rates, flows, market plumbing |
A Map for the Next Decade
US equities can remain essential. The issue is whether cap-weighted US beta alone is enough. If a portfolio is already heavily exposed to the same AI and mega-cap technology complex, additional “broad” US equity exposure may be less diversified than it appears.
Within equities, the next decade may reward more selectivity: quality at a reasonable price, cash-flow durability, energy and industrial infrastructure, defense, materials, and non-US markets when valuations and currencies cooperate. This is not an argument to rotate mechanically. It is an argument to stop treating the last decade’s winners as the only possible map.
Gold deserves a place in the conversation. It does not pay interest and it does not compound like a business. But gold is an old form of insurance when confidence in fiat money, central-bank policy, or the fiscal path is under strain.
Short-term Treasuries also matter. In a zero-rate world, cash felt like a punishment. In a higher-rate world, cash-like assets can reduce volatility while still producing income. Long bonds are more complicated: they can protect portfolios in recession, but they can also become a source of loss if inflation risk and fiscal supply pressure rise together.
After Petrodollars, the Token-Dollar Question
The dollar lost gold in the 1970s. It did not lose reserve-currency power. After convertibility ended, the dollar re-anchored itself through oil invoicing, Treasury markets, international banking, military reach, and trade settlement. That structure is often called the petrodollar system.
The next question is different:
If dollar dominance is reinforced again, what form will it take?
One possible answer is the token dollar. Stablecoins move dollars across blockchain rails. The US Senate Banking Committee’s GENIUS Act fact sheet describes a framework requiring payment stablecoins to be backed by 100% reserves, including US dollars and short-term Treasuries.
The token dollar is not only a stablecoin story. The more important link may be between AI model tokens and the dollar. US-based model companies such as OpenAI and Anthropic measure API usage in input and output tokens, and their public price tables are quoted in dollars. As companies and developers around the world use more frontier AI, they are effectively buying model tokens through a dollar price system.
If that structure grows, the analogy becomes sharper. Petrodollars worked because oil was priced and settled in dollars. An AI token dollar would work if access to frontier model tokens is also priced and settled through dollar payment rails. The payment method may be a card, cloud credit, enterprise contract, or stablecoin. The macro point is the price unit. If the invoice is in dollars, rising AI usage creates another channel of dollar demand.
If AI agents also begin buying and selling API calls, data, compute, ads, logistics, and software services, the token dollar becomes more than a remittance tool. It can become a settlement layer for the AI economy. Global stablecoin use may support demand for short-term dollar reserve assets. Global use of dollar-priced model tokens may make the dollar the price tag for a new digital production input.
That does not make the structure a free solution. If stablecoins become large, their reserves become more connected to Treasury bills and repo markets. The AI-token-dollar thesis also has clear limits. Open-source models, non-US model providers, local-currency billing, and sovereign AI infrastructure could weaken the dollar price tag. If AI-agent payments become large, delegated authority, mistaken instructions, settlement errors, and unclear liability become financial plumbing risks. Token dollars may reinforce dollar reach, but they may also create new fragility.
.jpg)


.jpg)


Why This Time Could Still Be Different
This argument should not become a doom loop. There are real reasons the next decade might avoid a 1970s-style outcome.
First, the US economy is less energy-intensive than it was in the early 1970s. Services, software, cloud infrastructure, and high-value intellectual property matter more. Oil still matters, but it is harder for an energy shock to hit the economy in the exact same way.
Second, the Fed knows the 1970s playbook. The Arthur Burns era taught every modern central banker the cost of letting inflation expectations drift. The Fed can still make mistakes, but it is not ignorant of the historical lesson.
Third, AI may become a genuine productivity revolution. The Nifty Fifty were mostly consumer, industrial, office-equipment, and healthcare franchises. Today’s AI leaders are building general-purpose infrastructure that could lower software costs, accelerate drug discovery, automate industrial processes, and raise labor productivity.
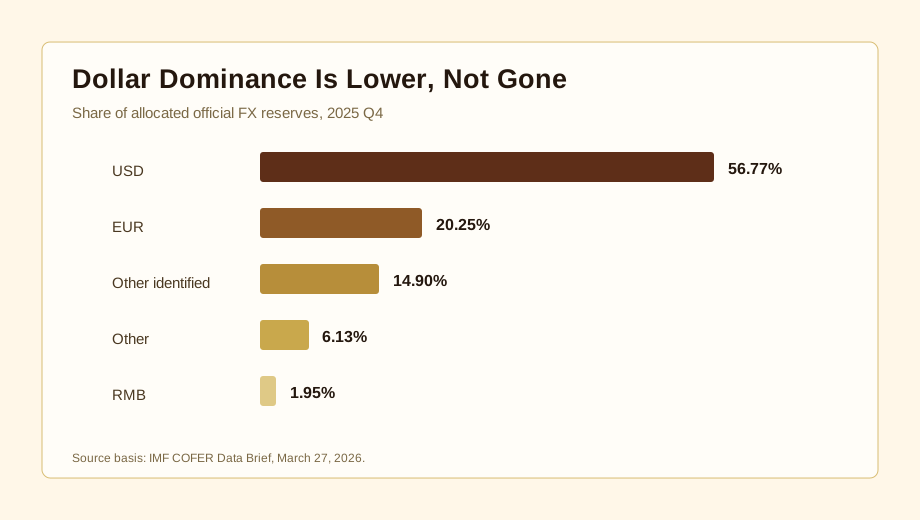
Fourth, the dollar is still strong. IMF COFER data show that the dollar’s reserve share has declined, but at 56.77% in 2025 Q4, it remains far ahead of any rival currency. Decline is not the same as collapse.
Fifth, concentration is not automatically a bubble. Today’s largest technology companies generate real earnings and cash flow. The issue is not concentration itself. The issue is whether the concentrated leaders can keep beating expectations embedded in their prices.
| Scenario | Macro condition | Market implication | What weakens it |
|---|---|---|---|
| AI productivity boom | Lower inflation + visible AI productivity | Mega-cap multiples hold | Capex fails to translate into revenue and margins. |
| Persistent inflation | Energy and services stay firm | Rate cuts delayed, growth pressured | Wages, shelter, and expectations all roll over. |
| Fiscal-dollar pressure | More Treasury supply and interest cost | Long bonds and dollar confidence tested | Treasury demand stays strong and fiscal expectations improve. |
| Market broadening | Earnings broaden beyond AI | Equal weight, ex-US, industrials improve | Profit growth narrows back to a few technology companies. |
What to Watch
For the shadow of 1973 to fade, several things need to happen together. Energy prices should stabilize. Service inflation and wage growth should cool. Inflation expectations should remain anchored. AI investment should begin producing visible productivity gains and cash flows outside a narrow group of suppliers.
The warning grows stronger if the opposite happens: inflation reaccelerates while markets keep expecting easier policy, a few AI-linked companies explain most of the index’s gain, or demand for long Treasuries weakens at the same time fiscal pressure rises.
Conclusion
1973 was painful for investors, but pain was not the whole story. The real importance of 1973 is that it marked a break in the assumptions that had worked before.
The 2026 US market may be near a similar testing point. The AI revolution may be real. The largest US technology companies remain formidable. The dollar is still the world’s central currency. But if inflation, energy, geopolitics, fiscal deficits, central-bank independence, market concentration, and the dollar system are all changing at once, investors should not simply repeat the last decade’s playbook.
The next market does not have to be a market where investors abandon equities. It may be a market where the gap between better stocks and worse stocks gets wider.
For much of the last decade, the market gave investors one answer:
“Just buy the S&P 500.”
The next decade may ask harder questions.
Which S&P 500? At what price? Under what rate regime? Under what dollar system? And is the portfolio really diversified?
For investors prepared to answer those questions, 2026 does not have to be the start of fear. It can be the start of preparing for the next regime.
Sources
- U.S. Office of the Historian, Nixon and the End of the Bretton Woods System, 1971-1973
- Federal Reserve History, Oil Shock of 1973-74
- Federal Reserve History, The Great Inflation
- U.S. Bureau of Labor Statistics, Consumer Price Index, April 2026
- Federal Reserve Board, Powell chair pro tempore press release, May 15, 2026
- Reuters / Jamie McGeever, stock market concentration, May 11, 2026
- Reuters / Lewis Krauskopf, semiconductor-led rally, May 13, 2026
- Reuters, Warsh regime change faces hurdles at the Fed, January 31, 2026
- Reuters, investors gird for high Treasury yields as Warsh battles inflation, May 14, 2026
- IMF COFER Data Brief, March 27, 2026
- OpenAI API pricing
- Anthropic models overview and pricing
- U.S. Senate Banking Committee, GENIUS Act fact sheet
- Google Cloud, Announcing Agent Payments Protocol, September 2025
- Visa, new era of commerce featuring AI and stablecoins, April 2025
- Wikimedia Commons, Shot tanks in Golan Heights, October 1973
- Wikimedia Commons, Coca-Cola bottle, CC0
- Wikimedia Commons / NASA Ames Research Center, IBM 7090 computer
- Wikimedia Commons, NVIDIA GPU cluster, CC BY 2.0
- Wikimedia Commons, Google data center, CC BY-SA 4.0
- Wikimedia Commons, Apple Park aerial view, CC BY-SA 4.0
- Visual Capitalist, Growth of $100 by Asset Class, based on Aswath Damodaran data